Description
This battery of tasks was used to assess a) the consistency and differentiation of emotional experiences, b) the consistency and differentiation of visual emotion representations, c) visual matching ability, and d) emotion recognition for dynamic motion cues (see Keating & Cook, pre-print).
Short summary of results from Keating & Cook (pre-print)
Across a series of experiments, we first develop and validate “EmoMap”, a novel method to map the shape of individuals’ emotional experience landscapes (Expt 1). Second, we develop “ExpressionMap” to map the shape of participants’ representations of how emotions are expressed in the outside world (Expt 2). Subsequently we illustrate a mapping between the way people feel “on the inside” and their representations of the way emotions are expressed in the “outside world”. That is, we find that individuals with modular internal emotional maps, who have consistent and distinct emotional experiences, tend to have consistent and distinct visual representations of other people’s emotional facial expressions, and correspondingly high emotion recognition abilities. People who struggle to differentiate their own emotional experiences tend to have blurry and overlapping visual representations of other’s emotions and corresponding difficulties with emotion recognition. Together, our results suggest that individual differences in navigating the social world of others’ facial expressions are inter-related with individual differences in the shape of one’s own internal emotional landscape.
Reuse
Researchers may use any of the materials provided here for academic and non-commercial purposes only as they are either owned by or licensed to the researchers or their institutions. In relation to such use, if you use any of the following tasks in your study, we ask that you cite the relevant paper (see below each task for citation) in your manuscript (CC BY). To facilitate reuse, data-processing and analysis scripts are provided at https://osf.io/hd8u2/wiki/home/
The materials are provided for use at your own risk and neither the researchers, their institutions, nor Cauldron Science provide any warranties of any kind nor does any of them accept responsibility for any conclusions that you draw from their use.
Built with Task Builder 1
Trial Structure
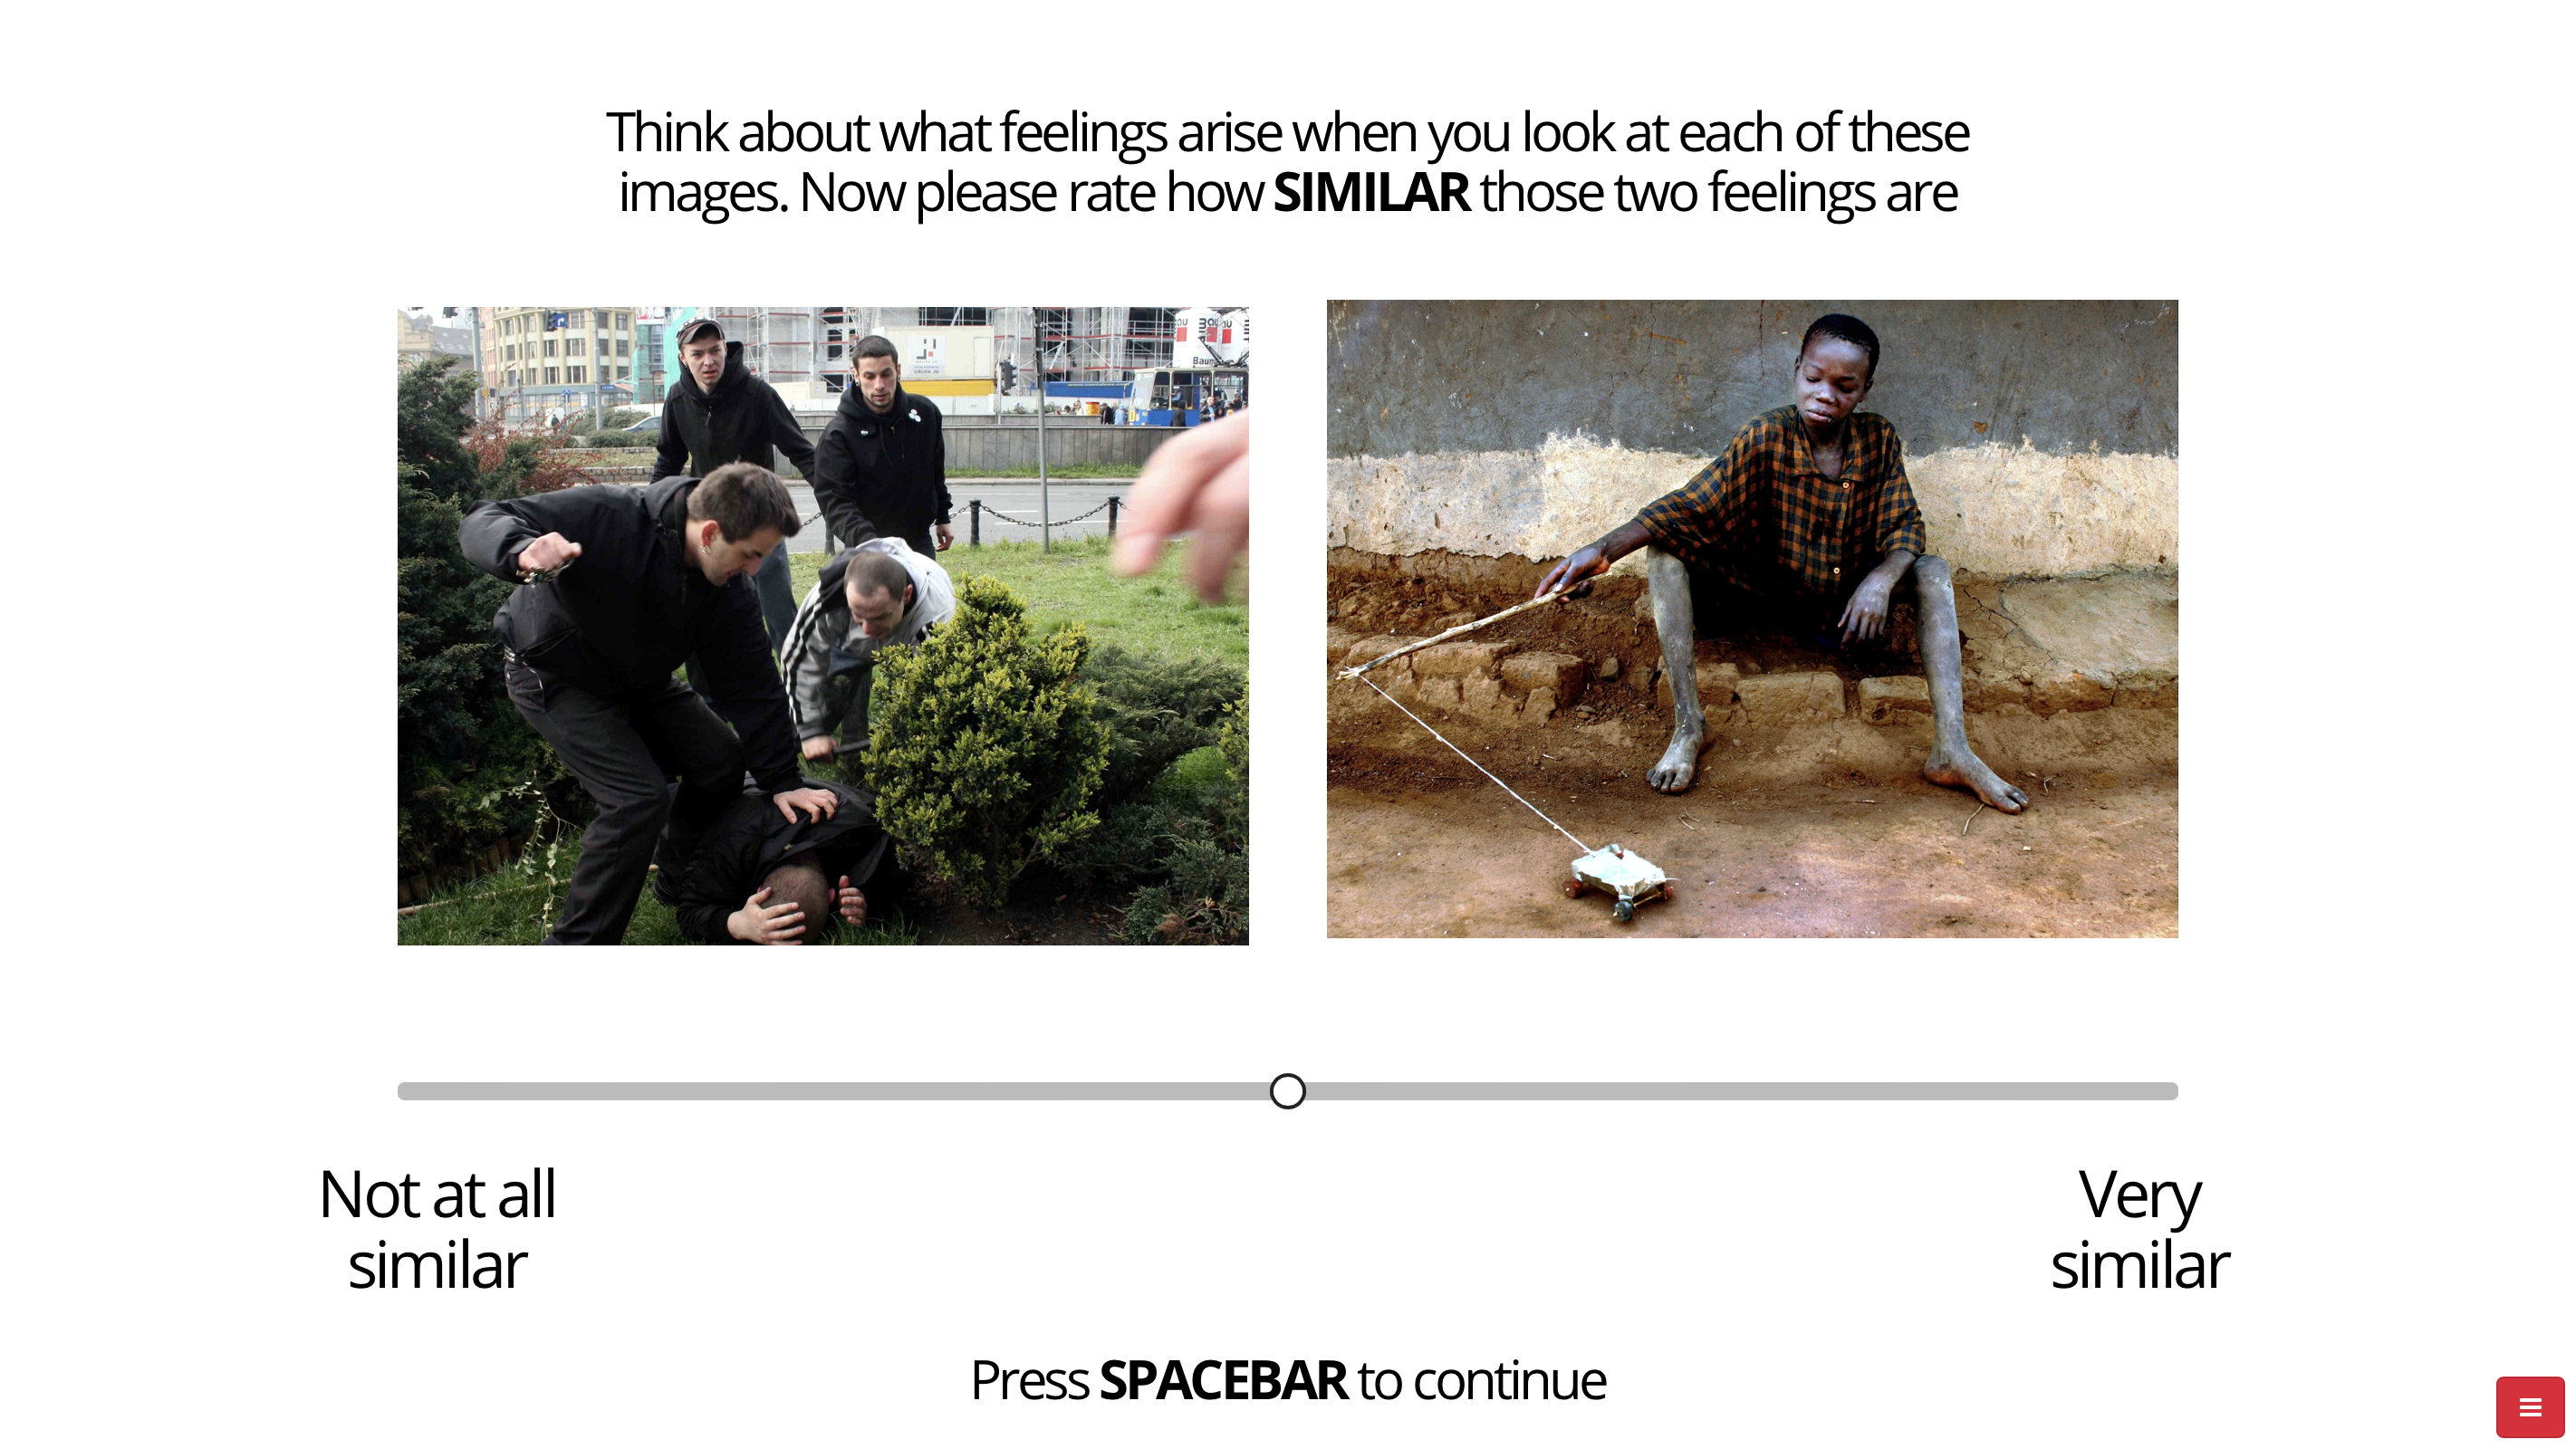
In this task, on each trial, participants view pairs of images (from the Nencki Affective Picture System; Marchewka et al., 2014) each known to selectively induce either anger, happiness or sadness (Riegel et al., 2016), and are asked to rate how similar the emotions evoked by the images are on a scale from 0, ‘Not at all similar’, to ten, ‘Very similar’ (to 4 decimal places).
Image selection
The chosen images were known to be effective at selectively inducing anger, happiness or sadness across large samples (N = 124; Riegel et al., 2016). In this task, there were five images for each emotion (anger, happiness and sadness) resulting in 15 different images and 105 unique image combinations (and therefore 105 trials): 30 within emotion-category combinations (10 for anger, 10 for happiness and 10 for sadness) and 75 between emotion-category combinations (25 angry-sad, 25 angry-happy, 25 happy-sad).
Score calculation and data-processing
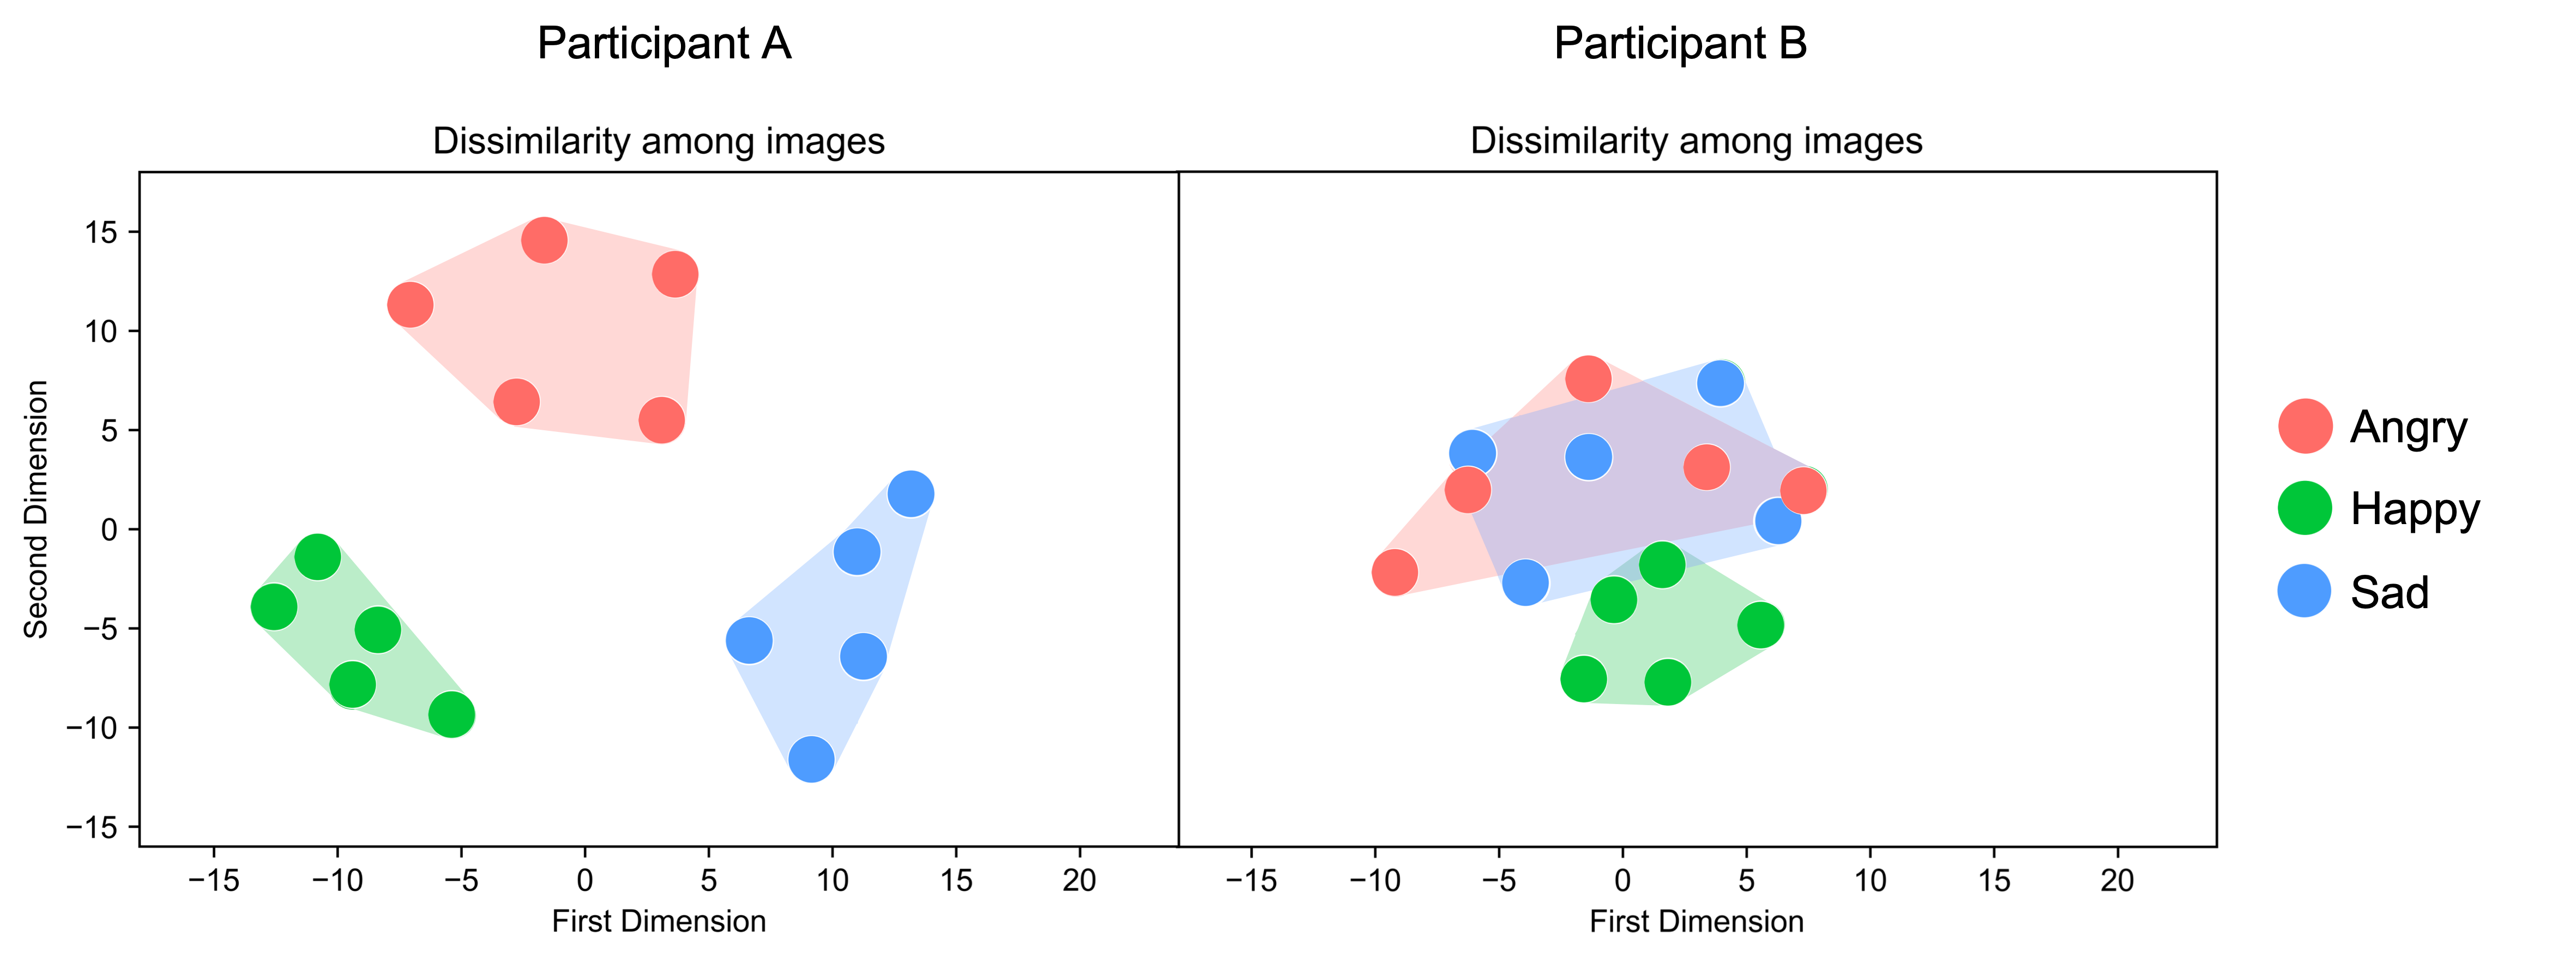
To assess between-category and within-category emotion differentiation, the similarity ratings can be transformed into (Euclidean) distance scores through multidimensional scaling (using the Scikit-learn library in Python). Multidimensional scaling (MDS) is a statistical technique that represents objects (emotional images, lexical items etc.) as points in multidimensional space wherein close similarity between objects corresponds to close distances between the corresponding points in the representation (van der Klis & Tellings, 2022). The distance between points in multidimensional space can then be plotted (see Screenshot 3). Mean distances within specific emotion clusters can be calculated by taking the average of the Euclidean distances for the 10 angry-angry, 10 happy-happy and 10 sad-sad image pairs, respectively. Mean distances between specific emotion clusters can be calculated by taking the mean of the Euclidean distances for the 25 angry-happy, 25 angry-sad, and 25 happy-sad image pairs, respectively. Following this, one can compute mean distances within and between clusters by averaging across emotions/emotion pairs. Larger distances between and emotion clusters reflect greater between-category emotion differentiation (i.e., one's ability to differentiate anger, happiness and sadness). Larger distances within emotion clusters reflects greater within-category emotion differentiation (i.e., one's ability to make fine-grained distinctions between similar emotional states such as sadness, disappointment and despair).
Go to the following links for the data-processing scripts
Quality Checks
A reaction time check was incorporated to prevent participants responding too quickly (i.e., without thinking). Responses faster than 1000ms resulted in an error message (“Too Fast. Our algorithm has detected that you might need to take longer to think through your answer. You will now incur a 5 second penalty and then will be asked to do the trial again”) and a 5-second penalty, and then the trial was re-started.
Creative Commons Attribution-NonCommercial (CC BY-NC)
Keating, C. T., & Cook, J. L. (2023). The inside out model of emotion recognition: How the shape of one’s internal emotional landscape influences the recognition of others’ Emotions. Scientific Reports, 13(1), 21490.
https://doi.org/10.1038/s41598-023-48469-8
Keating, C. T., & Cook, J. (2022). Sadness, sorrow, or despair: Improving existing tasks assessing emotional granularity.
https://doi.org/10.31234/osf.io/jxhe6
Keating, C. T., Kraaijkamp, C., & Cook, J. (pre-print). Similarities and differences in the psychological mechanisms involved in autistic and non-autistic emotion recognition.
https://psyarxiv.com/6deqs/
Built with Task Builder 1
Trial structure
In this task, on each trial participants are required to make decisions about three images (also from the Nencki Affective Picture System; Marchewka et al., 2014). There are four conditions: one non-emotional control condition, and three emotional experimental conditions exploring the experience of anger, happiness and sadness respectively. Participants complete the control condition first. In this condition, participants are required to select which of the three (emotionally neutral) images they find most colorful using their mouse cursor. Two of these images are in color and one is in grayscale, thus serving as an attention check. Following this, participants complete the three experimental conditions in a random order. In these conditions, participants are required to select which of the three images make them feel most angry, happy or sad using their mouse cursor (i.e., in the ‘angry condition’ participants would have to decide which image made them most angry). As in the control condition, there is a ‘trap’ image on each trial such that two of the images are strong inducers of the target emotion (e.g., sadness), and one is a strong inducer of another emotion (e.g., happiness), thus serving as an attention check. If participants select the "trap" image, they are presented with an error message ("Try Again. Our algorithm has detected that you might need to take longer to think through your answer. You will now incur a 5 second penalty and then will be asked to do the trial again”). They then incur a 5-second penalty and are asked to do the trial again. Within each condition, there were 11 target (i.e., non-trap) images which were presented in all possible unique pairs across 55 trials.
Image selection
The images that were selected had previously been identified as successful inducers of the target emotion (Riegel et al., 2016). In addition, in order to make the experimental conditions comparable, we ensured that the mean intensity ratings (angry = 3.53; happy = 3.50; sad = 3.56) and standard deviation of intensity ratings across images within a condition (angry = 0.80; happy = 0.80; sad = 0.81) were similar for each emotion.
Score calculation and data-processing
Consistency scores are calculated for each condition in line with the logical consistency of a participants’ decisions. To illustrate, if a participant selects image A over image B (A > B) and image B over image C (B > C), these decisions are all consistent with one another. However, if the participant then selected image C over image A, this would be inconsistent with their previous judgments. Consistency requires participants to differentiate precisely between the intensity of emotion evoked by each image. Thus, inconsistent decisions are likely to stem from inconsistencies in in how individuals experience an emotion across multiple instances.
We follow the procedures of Huggins et al., (2021) to calculate emotional consistency (termed emotional consistency in their manuscript). We first quantify each participant’s image rankings by summing the number of times they choose each image. If a participant makes completely consistent decisions in a set, rank scores would follow a linear sequence: the image they found most emotionally intense (or colorful) should be chosen in all ten trials it appeared (score = 10), the second-highest should be chosen in nine of ten trials (score = 9), and so on, the image they found least emotionally intense (or colorful) should never be chosen (score = 0). Subsequently, we examine how image rankings related to the decisions made on each trial. Images with a higher rank score should elicit a stronger emotional response than those with lower rank scores, an inconsistent decision would occur when a lower-ranking image is chosen over a higher-ranking image. For each trial, the rank score of the unchosen item is subtracted from the rank score for the chosen item, producing item differences. For inconsistent decisions the item difference would be less than or equal to zero. More severe inconsistencies (e.g. choosing the lowest ranked image over the highest ranked image) result in more negative item differences. Item differences are then summed, per condition, to produce total consistency scores, with greater scores reflecting higher consistency. If a participant makes no inconsistent decisions within a condition, their score would be 220.
See https://osf.io/v4dns for data-processing script
Quality checks
A reaction time check was incorporated to prevent participants responding too quickly (i.e., without thinking). Responses faster than 1000ms resulted in the error message mentioned above (“Try Again. Our algorithm has detected that you might need to take longer to think through your answer. You will now incur a 5 second penalty and then will be asked to do the trial again”) and a 5-second penalty, and then the trial was re-started. In addition, on each trial there was a "trap image" which served as an attention check (see above).


Creative Commons Attribution-NonCommercial (CC BY-NC)
Keating, C. T., & Cook, J. L. (pre-print). The Inside Out Model of Emotion Recognition: How the Shape of One’s Internal Emotional Landscape Influences the Recognition of Others’ Emotions.
https://psyarxiv.com/476dk/
Keating, C. T., Kraaijkamp, C., & Cook, J. (pre-print). Similarities and differences in the psychological mechanisms involved in autistic and non-autistic emotion recognition.
https://psyarxiv.com/6deqs/
Built with Task Builder 1
Please note that this task must be completed on Google Chrome or Mozilla Firefox
Trial Structure
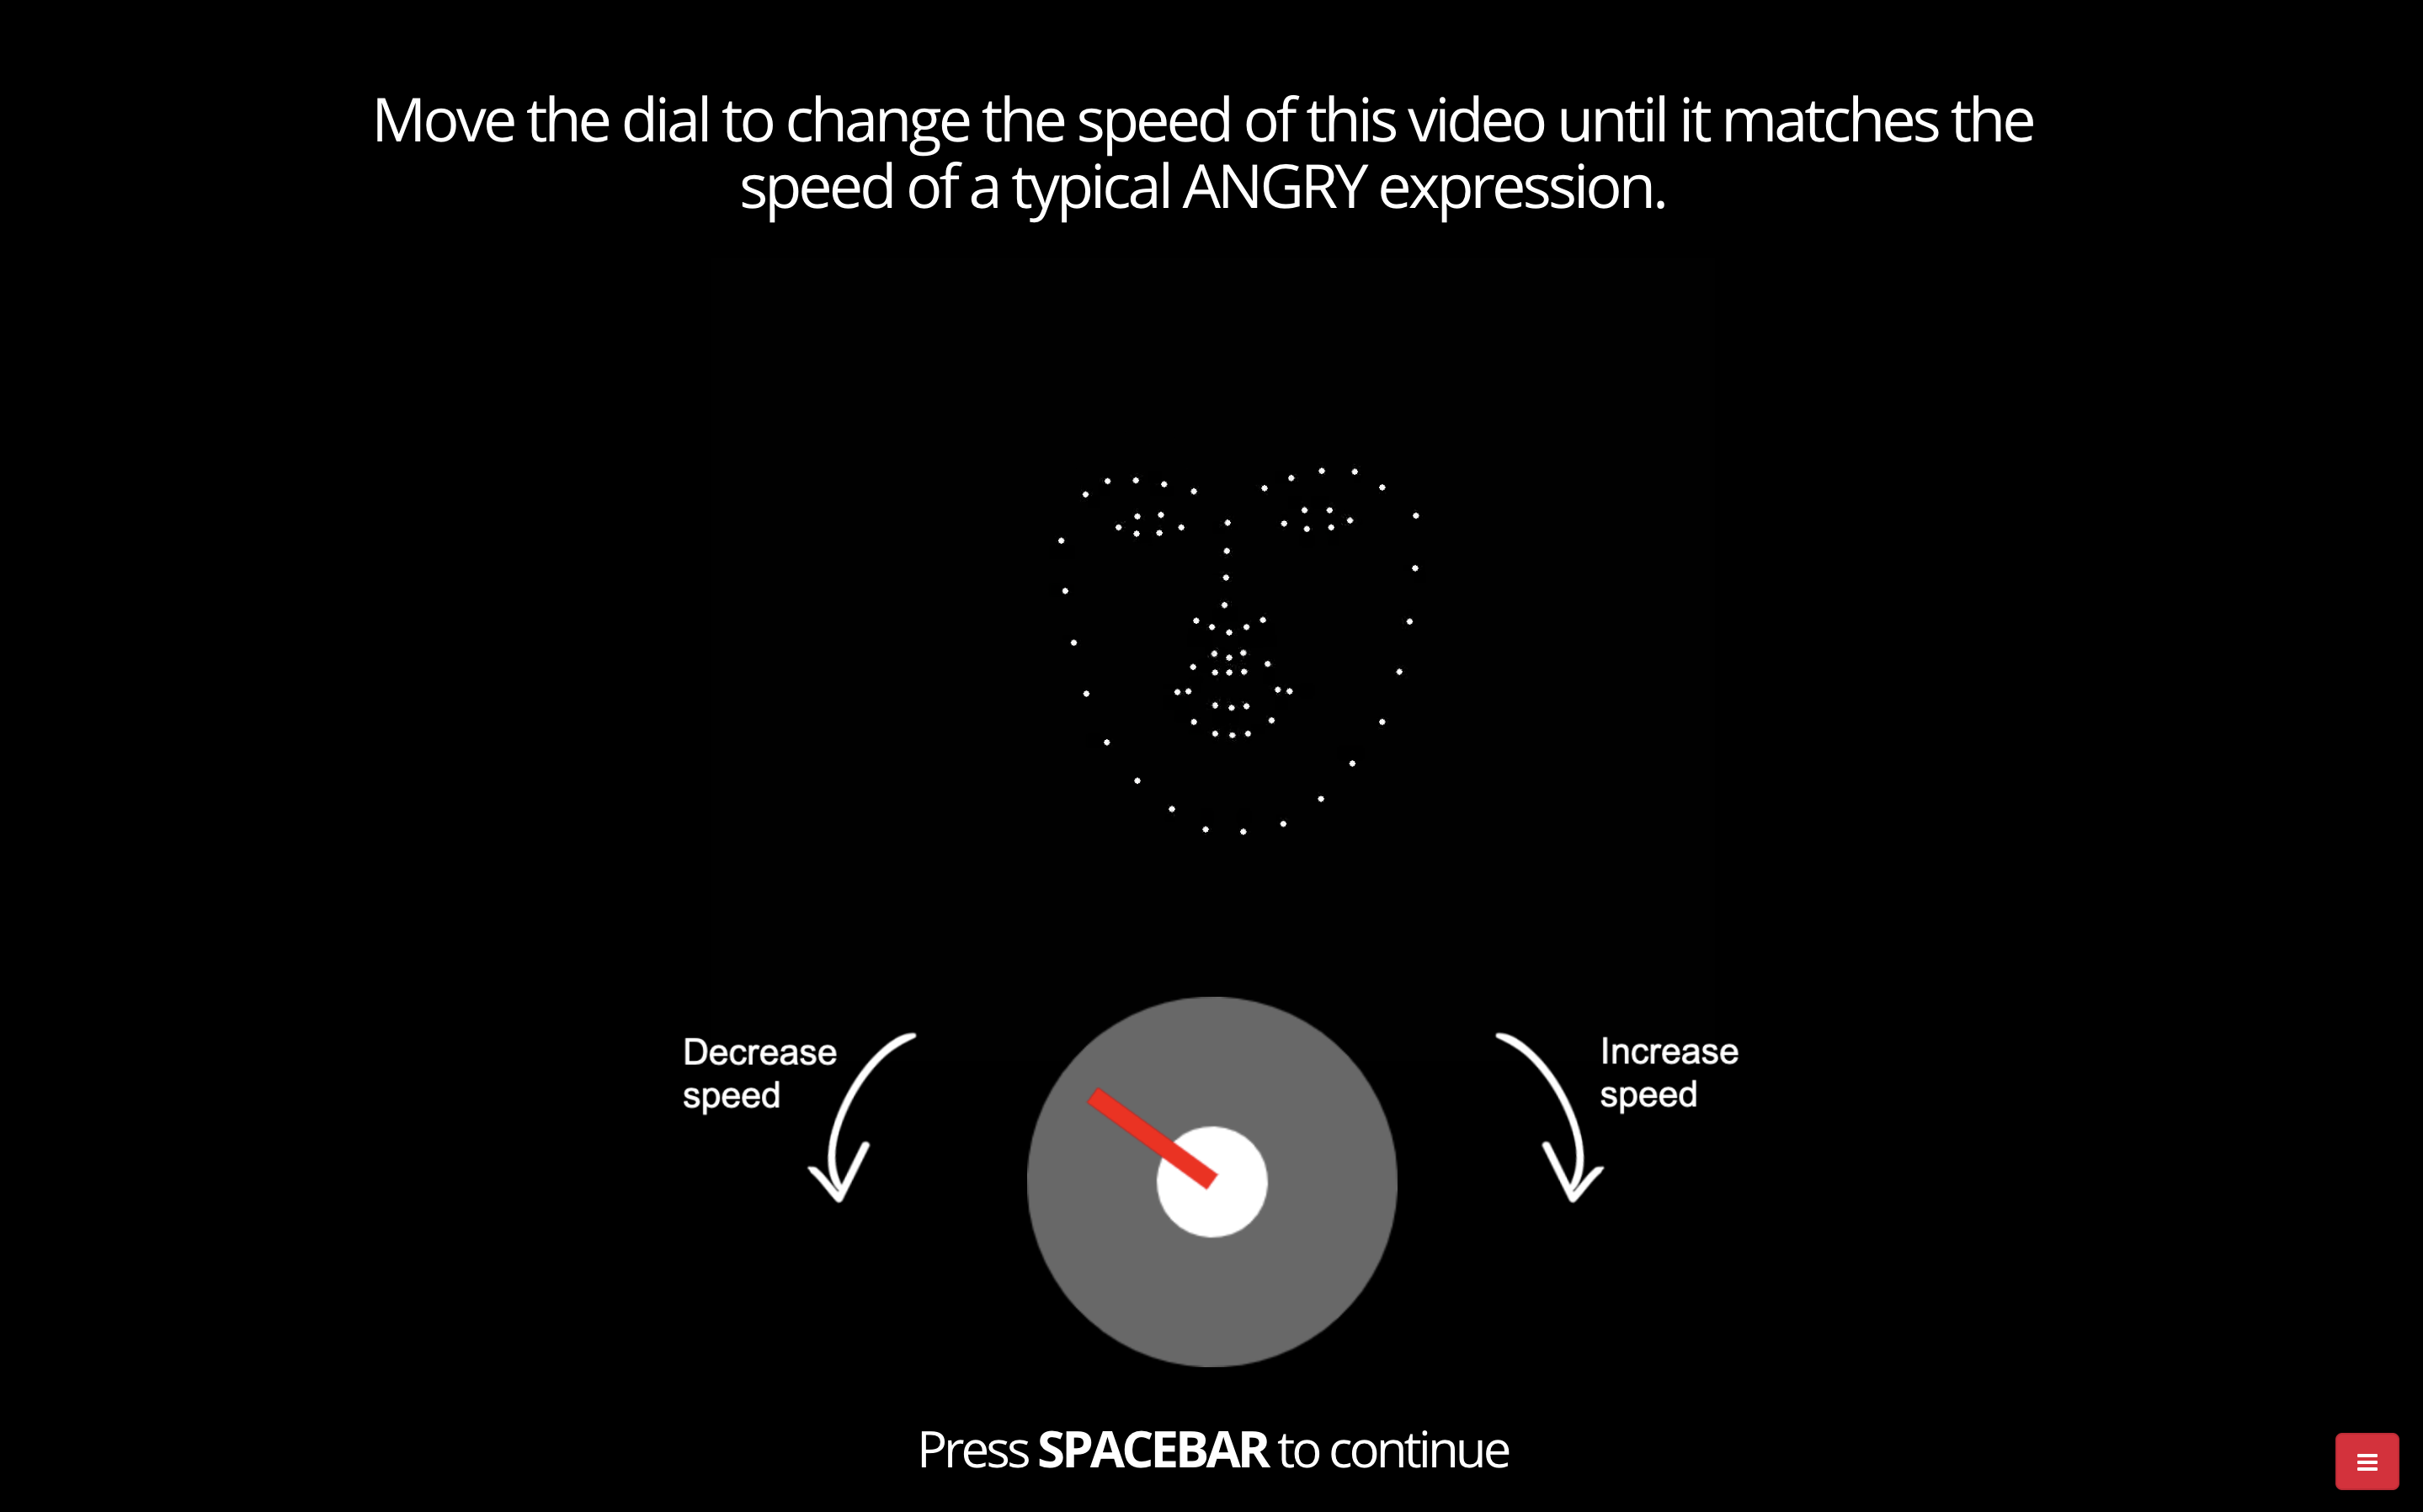
In this task, on each trial, participants are presented with an emotional dynamic point light display of the face (PLF; on average approximately 6 seconds in length) that loops such that it played continuously. Participants are instructed to “move the dial to change the speed of the video until it matches the speed of a typisal ANGRY/HAPPY/SAD expression”. The PLFs were originally created by asking actors to read a sentence (“my name is John and I’m a scientist”) in a happy, angry or sad manner (Sowden et al., 2021). The emotion depicted in the stimulus video matches the instructed emotion, i.e., on a trial where an angry facial expression is presented, participants are only asked to manipulate the speed of the video so that it matched the speed of a typical angry expression. Consequently, participants are matching the speed of the displayed PLF to their imagined visual representation of that expression (the speed they would imagine “in their mind’s eye”). Participants can change the speed of the video by moving a dial clockwise to increase the speed of the animation or anticlockwise to decrease the speed of the animation. The minimum and maximum point on the dial correspond with 25% and 300% of the recorded speed respectively. Once participants are satisfied they can press the spacebar to continue. There is no time limit for participants to respond on each trial. Participants are shown four repetitions of each PLF stimulus video (each one starting at a random speed) across four actors. This results in 16 videos per emotion (4 actors x 4 repetitions x 3 emotions = 48 trial in total). Participants complete three practice trials (one for each emotion at 100% starting speed) and then the 48 randomly ordered experimental trials across three blocks. Participants are given the opportunity to take breaks between blocks.
Quality checks and design features
This task was adapted from Keating, Sowden & Cook (2022b). In the current study we improved the task by a) using a dial, instead of the slider used previously, thus making the minimum and the maximum points on the scale more ambiguous, b) starting each video at a random speed thus reducing potential response biasing, c) setting the initial dial position to a random orientation that did not correspond to starting speed, thus ensuring that the minimum and maximum points, and the point of the 100% recorded speed were at different spatial locations on the dial – as a result, participants were unable to be consistent simply by selecting a similar location on the scale each time -, d) incorporating a reaction time check- when participants responded faster than 5 seconds on a trial, they were presented with an error message, incurred a 5 second penalty, and then were asked to do the trial again and, e) incorporating a walk-through video to facilitate comprehension of task instructions.
Score calculation and data-processing
ExpressionMap provides an index of the percentage speed attributed to each of the stimulus videos by participants (e.g., if a participant attributes 130% speed to an expression, their representation for that expression is 1.3 times faster than the recorded speed). Following the procedures outlined in Keating, Sowden & Cook (2022b), we calculated the true speed attributed to each of the PLFs (in pixels per frame) by multiplying the percentage speed attributed, divided by 100, with the speed of the actor’s facial movement in the original video. For example, for a trial in which a participant attributed 200% speed to a face moving at 2.5 pixels/frame, the true speed attributed to the expression would be 5 pixels/frame [i.e., (200÷100) × 2.5] (see Keating, Sowden & Cook, 2022b for more information).
This task operates on the premise that, compared to participants with consistent visual representations, those with less consistent representations of emotion would attribute more variable speeds to the expressions. For instance, someone with consistent visual representations of anger would be consistent in their attributions (e.g., by attributing 120% speed, 121% speed and 119% speed to the angry expression). In contrast, someone with less consistent visual representations would be more variable (e.g., by attributing 120% speed, 60% speed and 180% speed to an angry expression). Therefore, to index the consistency of visual emotion representations, we take the standard deviation of the speeds attributed to one emotion for one actor (i.e., actor 1, angry expression) across the 4 video repetitions. Following this, we multiply these variability scores by -1 so that the variable now represents consistency. We then calculate mean representational consistency for each of the emotions (angry, happy and sad) by taking a mean of the consistency scores for each actor within an emotion (e.g., taking a mean of the consistency scores for angry expressions across actors 1, 2, 3 and 4). Mean representational consistency is calculated by taking a mean of the consistency scores for the angry, happy and sad PLFs.
Finally, this task also provides an index of the ‘distance’ between emotions in participants’ visual representations of facial expressions. To calculate distance scores, we subtract the speed attributed to one emotion from the speed attributed to another and then take the absolute value of this number. For example, to calculate distance between happy and angry, we subtract the speed attributed to happy from the speed attributed angry, and then take the absolute value. Mean distance is calculating by taking a mean of the scores for the angry-happy, angry-sad, and happy-sad distances.
See https://osf.io/c3ezx for data-processing and analysis scripts
Creative Commons Attribution-NonCommercial (CC BY-NC)
Keating, C. T., & Cook, J. L. (2023). The inside out model of emotion recognition: How the shape of one’s internal emotional landscape influences the recognition of others’ Emotions. Scientific Reports, 13(1), 21490.
https://doi.org/10.1038/s41598-023-48469-8
Keating, C. T., Sowden, S., & Cook, J. L. (2022). Comparing internal representations of facial expression kinematics between autistic and non‐autistic adults. Autism Research, 15(3), 493-506.
https://onlinelibrary.wiley.com/doi/abs/10.1002/aur.2642
Keating, C. T., Ichijo, E., & Cook, J. L. (2023). Autistic adults exhibit highly precise representations of others’ emotions but a reduced influence of emotion representations on emotion recognition accuracy. Scientific Reports, 13(1), 11875.
https://doi.org/10.1038/s41598-023-39070-0
Built with Task Builder 1
Please note that this task must be completed on Google Chrome or Mozilla Firefox
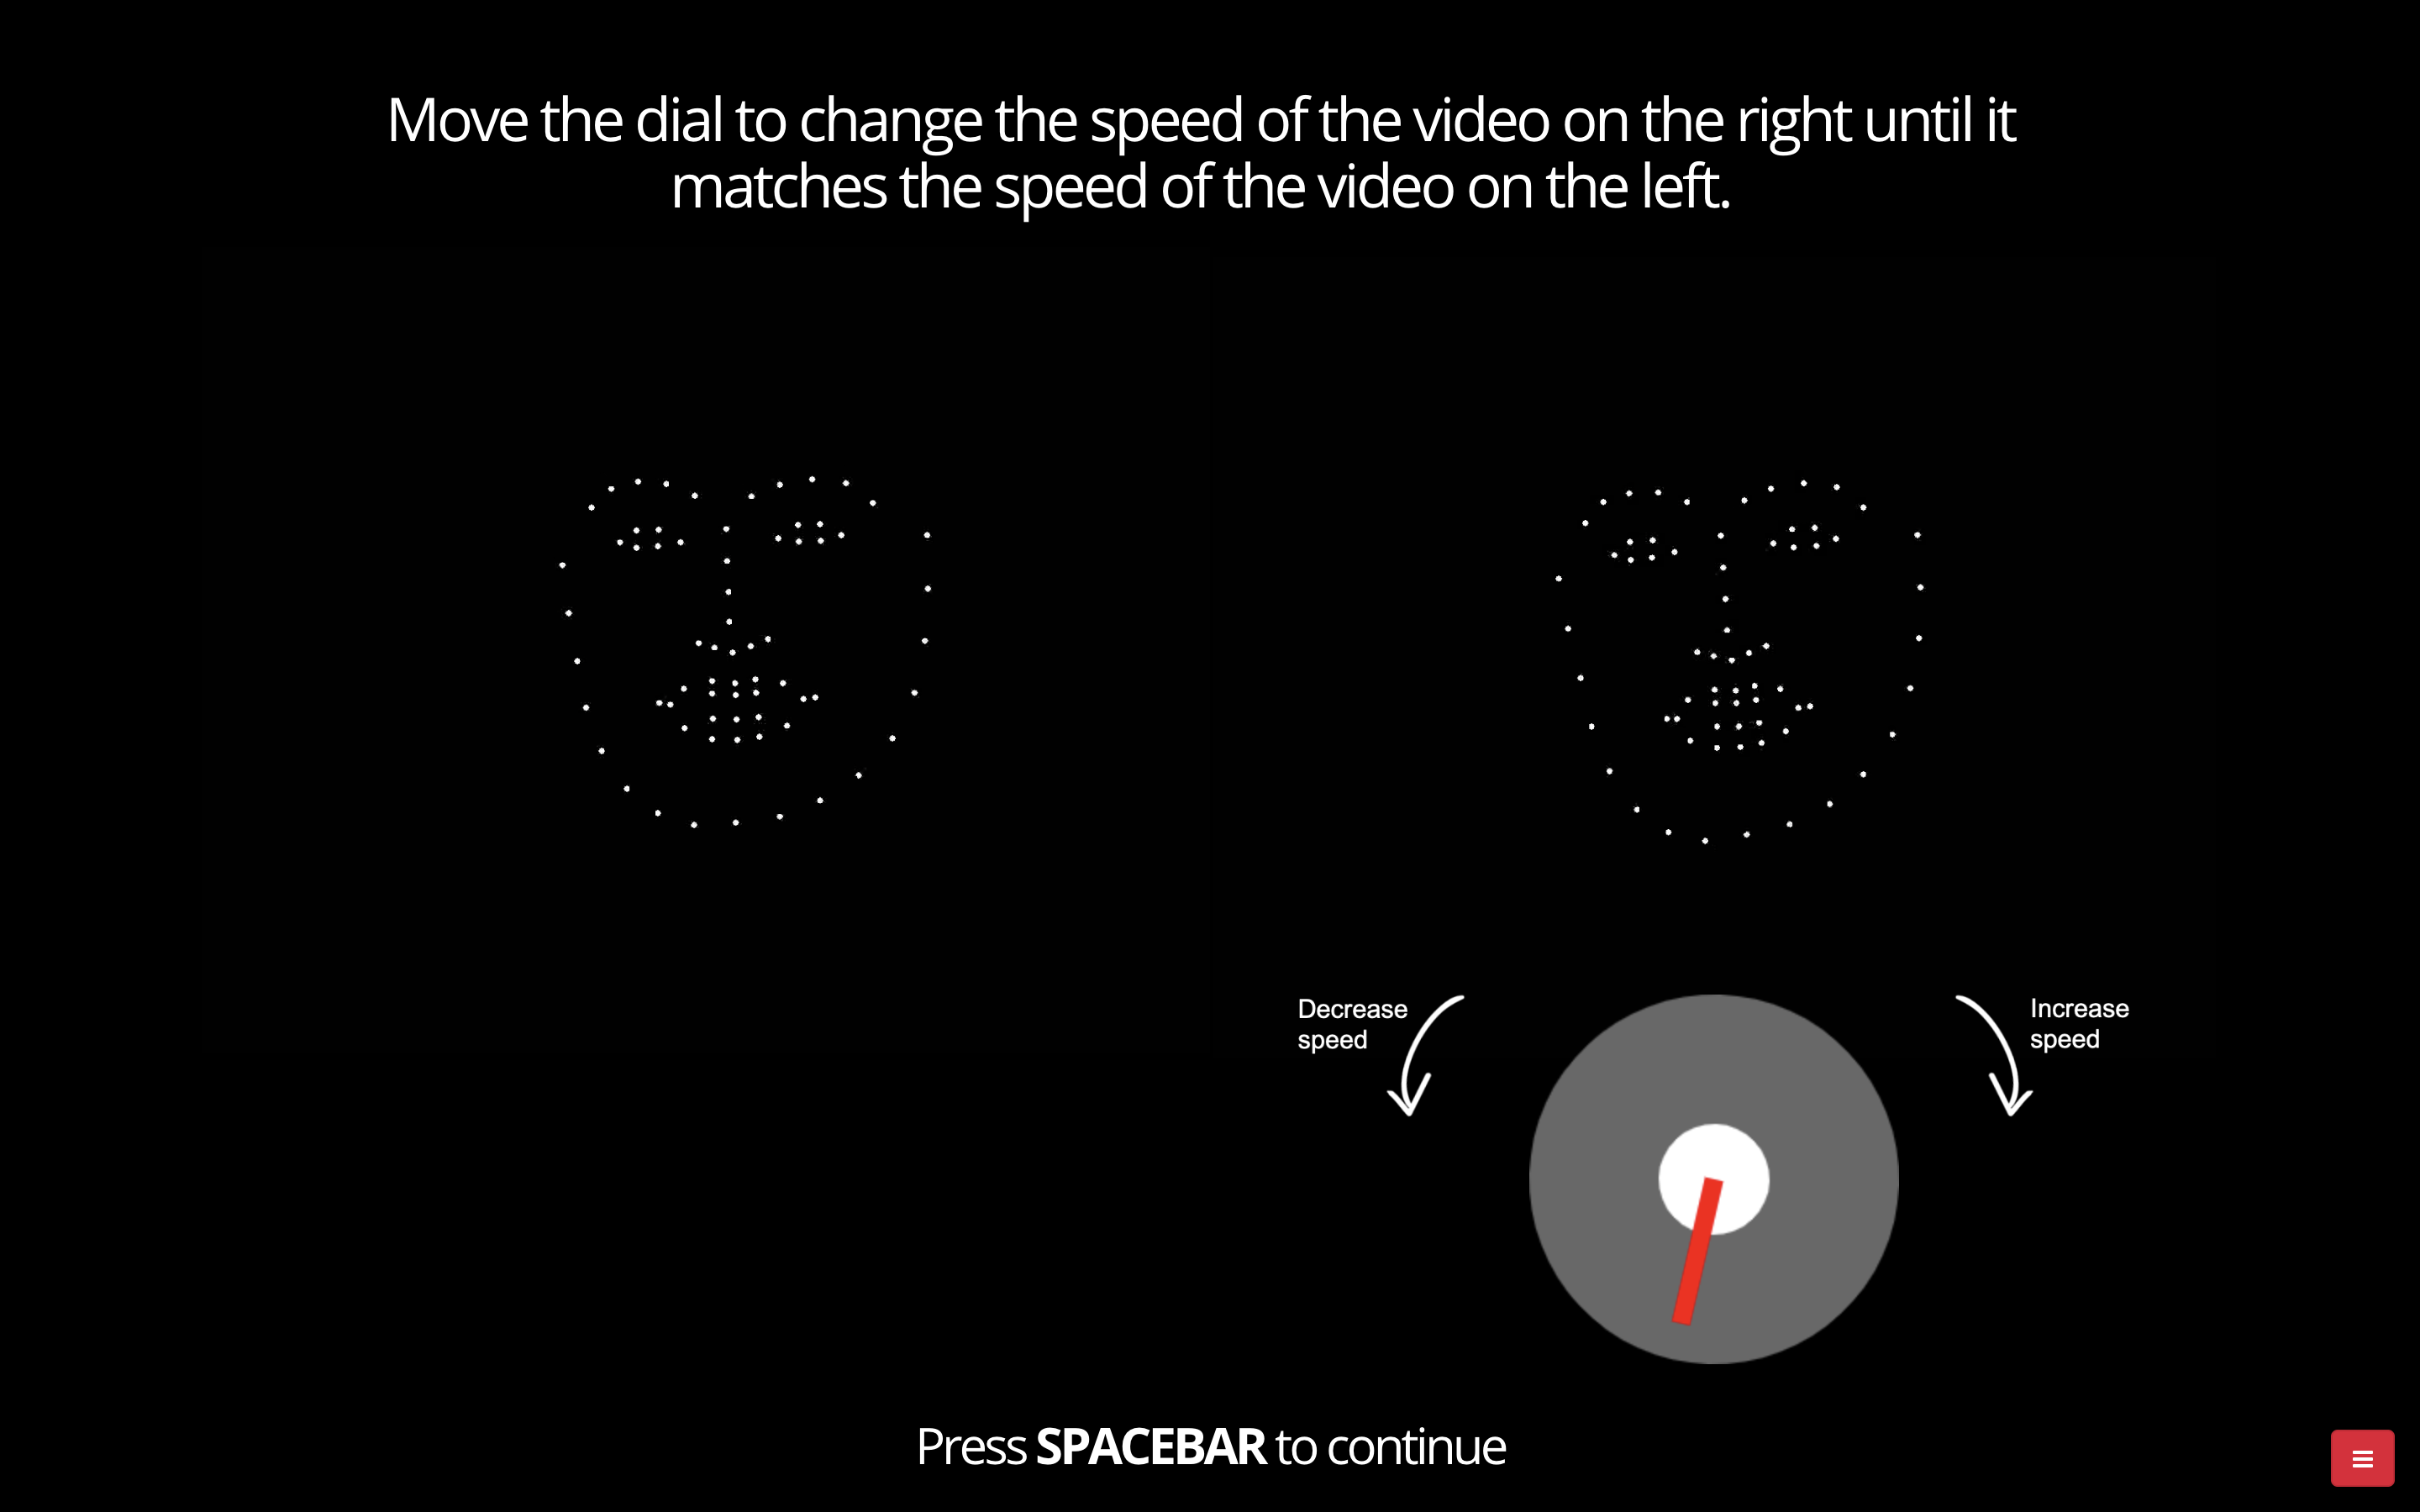
Trial structure
In this task, each trial begins with an angry, happy, or sad dynamic point light display of the face (PLF; on average approximately 6 seconds in length) being shown on the left-hand side of the screen. After this video has played once, the same PLF stimulus video also appears on the right-hand side of screen, moving at a random speed, and continues to play in a loop. Participants are instructed to “move the dial to change the speed of the video on the right until it matches the speed of the video on the left”. Turning the dial clockwise increases speed; turning the dial anticlockwise decreases speed. The minimum and maximum points on the dial correspond with 25% speed and 300% of the recorded speed respectively (participants are not explicitly informed about this). Once the participant is satisfied that the two videos are moving at the same speed, they press spacebar to continue. Participants are shown four repetitions of each PLF stimulus video for each of four actors; each repetition has a different starting speed. In each full set of 16 (4 actors x 4 repetitions) stimulus videos for an emotion, the starting speed ranges from 50% to 200% of the recorded speed, in 10% increments (i.e., 50%, 60%, 70%, 80%, 90%, 100%, 110%, 120%, 130%, 140%, 150%, 160%, 170%, 180%, 190%, 200%). This range of starting speeds ensures that participants were able to match across a variety of speeds. Participants complete three practice trials (one for each emotion at 100% starting speed) and then 48 randomly ordered experimental trials across three blocks. Participants are given the opportunity to take breaks between blocks.
Score calculation and data-processing
The Visual Matching task provides an index of how well participants can visually match the speed of one expression to another. To calculate deviation scores, we subtract the percentage speed attributed to the expression on the right from the percentage speed of the video on the left and take the absolute value of this deviation score as a measure of how far away the speeds of the two animations were (irrespective of whether they attributed too high or too low speed). Finally, we calculate mean deviation scores by taking a mean of all of the absolute deviation scores. Higher deviation scores represent greater difficulties matching the two expressions.
See https://osf.io/rkdtv for data-processing script
Quality checks
A reaction time check was incorporated to prevent participants responding too quickly (i.e., without thinking). Responses faster than 5000ms resulted in an error message (“Too Fast. Our algorithm has detected that you might need to take longer to think through your answer. You will now incur a 5 second penalty and then will be asked to do the trial again”) and a 5-second penalty, and then the trial was re-started. A walk-through instruction video was also included to facilitate comprehension of the task.

Creative Commons Attribution-NonCommercial (CC BY-NC)
Keating, C. T., & Cook, J. L. (pre-print). The Inside Out Model of Emotion Recognition: How the Shape of One’s Internal Emotional Landscape Influences the Recognition of Others’ Emotions.
https://psyarxiv.com/476dk/
Keating, C. T., Ichijo, E., & Cook, J. L. (2023). Autistic adults exhibit highly precise representations of others’ emotions but a reduced influence of emotion representations on emotion recognition accuracy. Scientific Reports, 13(1), 11875.
https://doi.org/10.1038/s41598-023-39070-0
Built with Task Builder 1
Please note that this task must be completed on Google Chrome or Mozilla Firefox
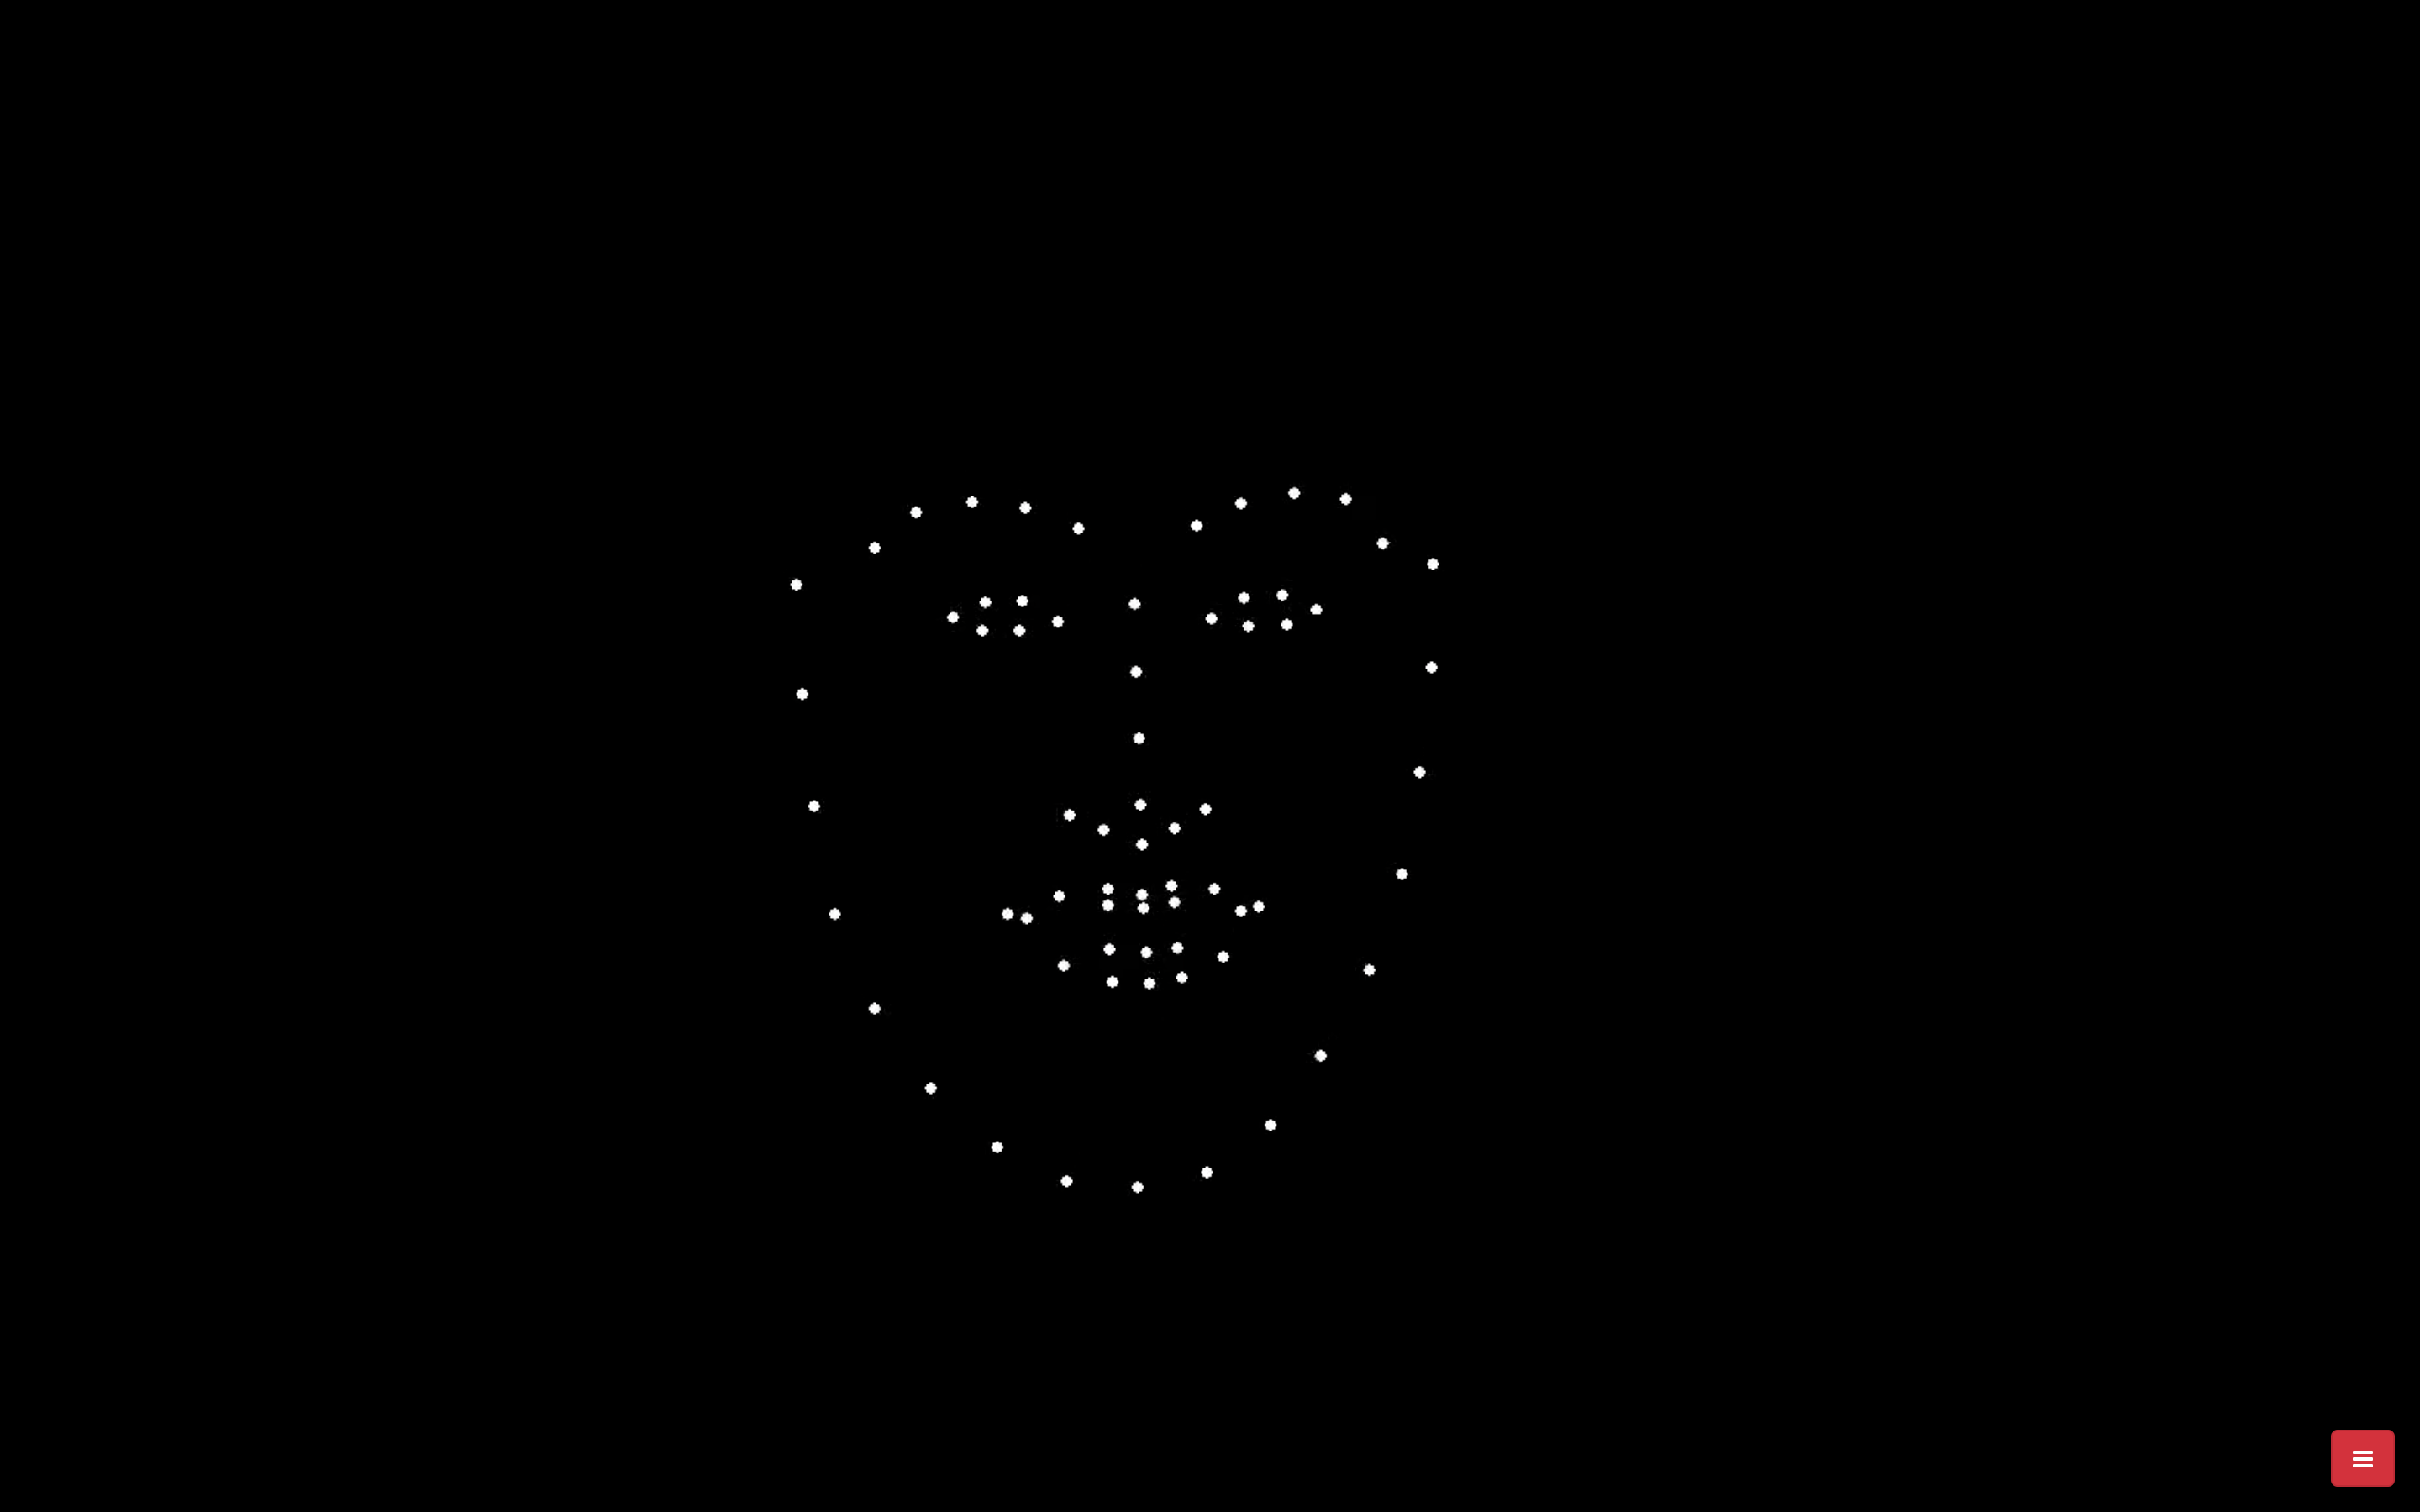
Selected stimulus videos
The stimulus videos comprised dynamic PLF stimuli, created from videos of four actors (two male, two female) verbalising sentences (“My name is John and I’m a scientist”) whilst posing three target emotions (angry, happy and sad). PLFs were adapted (see Sowden et al., for further detail) to achieve three spatial movement levels, ranging from decreased to increased spatial movement (S1: 50% spatial movement; S2: 100% spatial movement; S3: 150% spatial movement), and three kinematic levels, ranging from reduced to increased speed (K1: 50% original stimulus speed; K2: 100% original stimulus speed; K3—150% of the original stimulus speed). Consequently, there were 9 manipulations per emotion (e.g., (1) S1, K1, (2) S2, K1, (3) S3, K1, (4) S1, K2, (5) S2, K2, (6) S3, K2, (7) S1, K3, (8), S2, K3, (9) S3, K3).
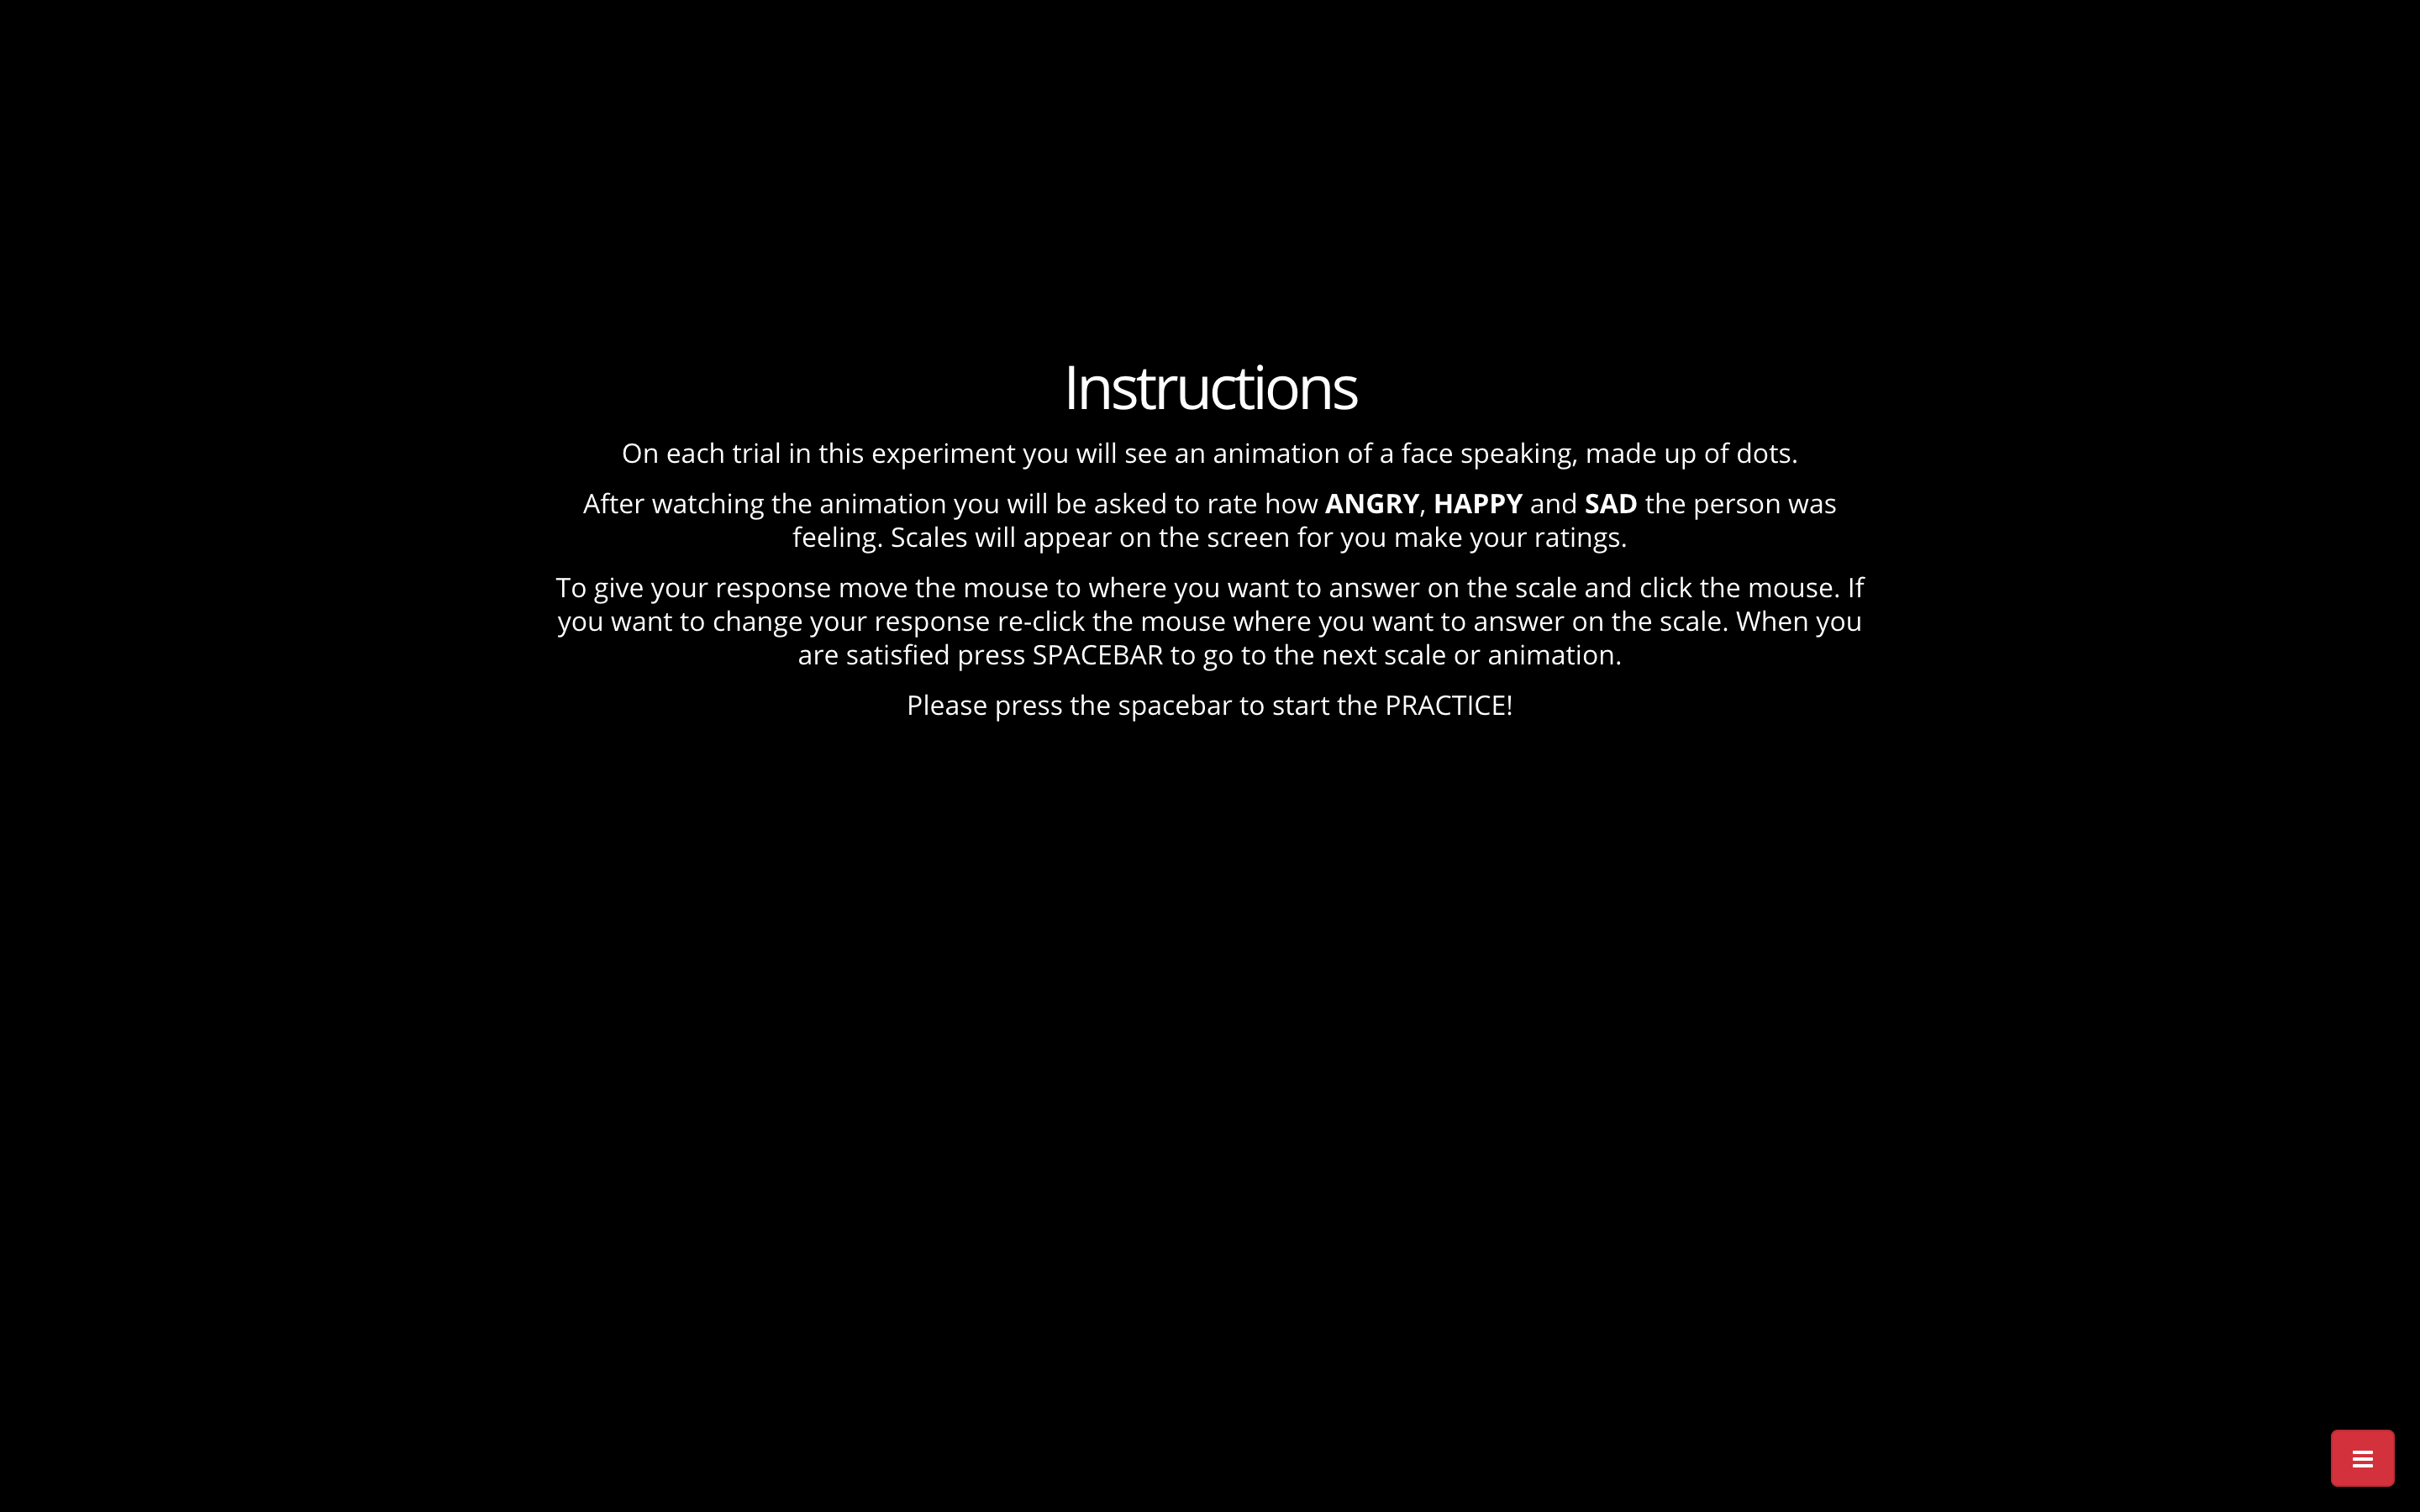
Trial structure
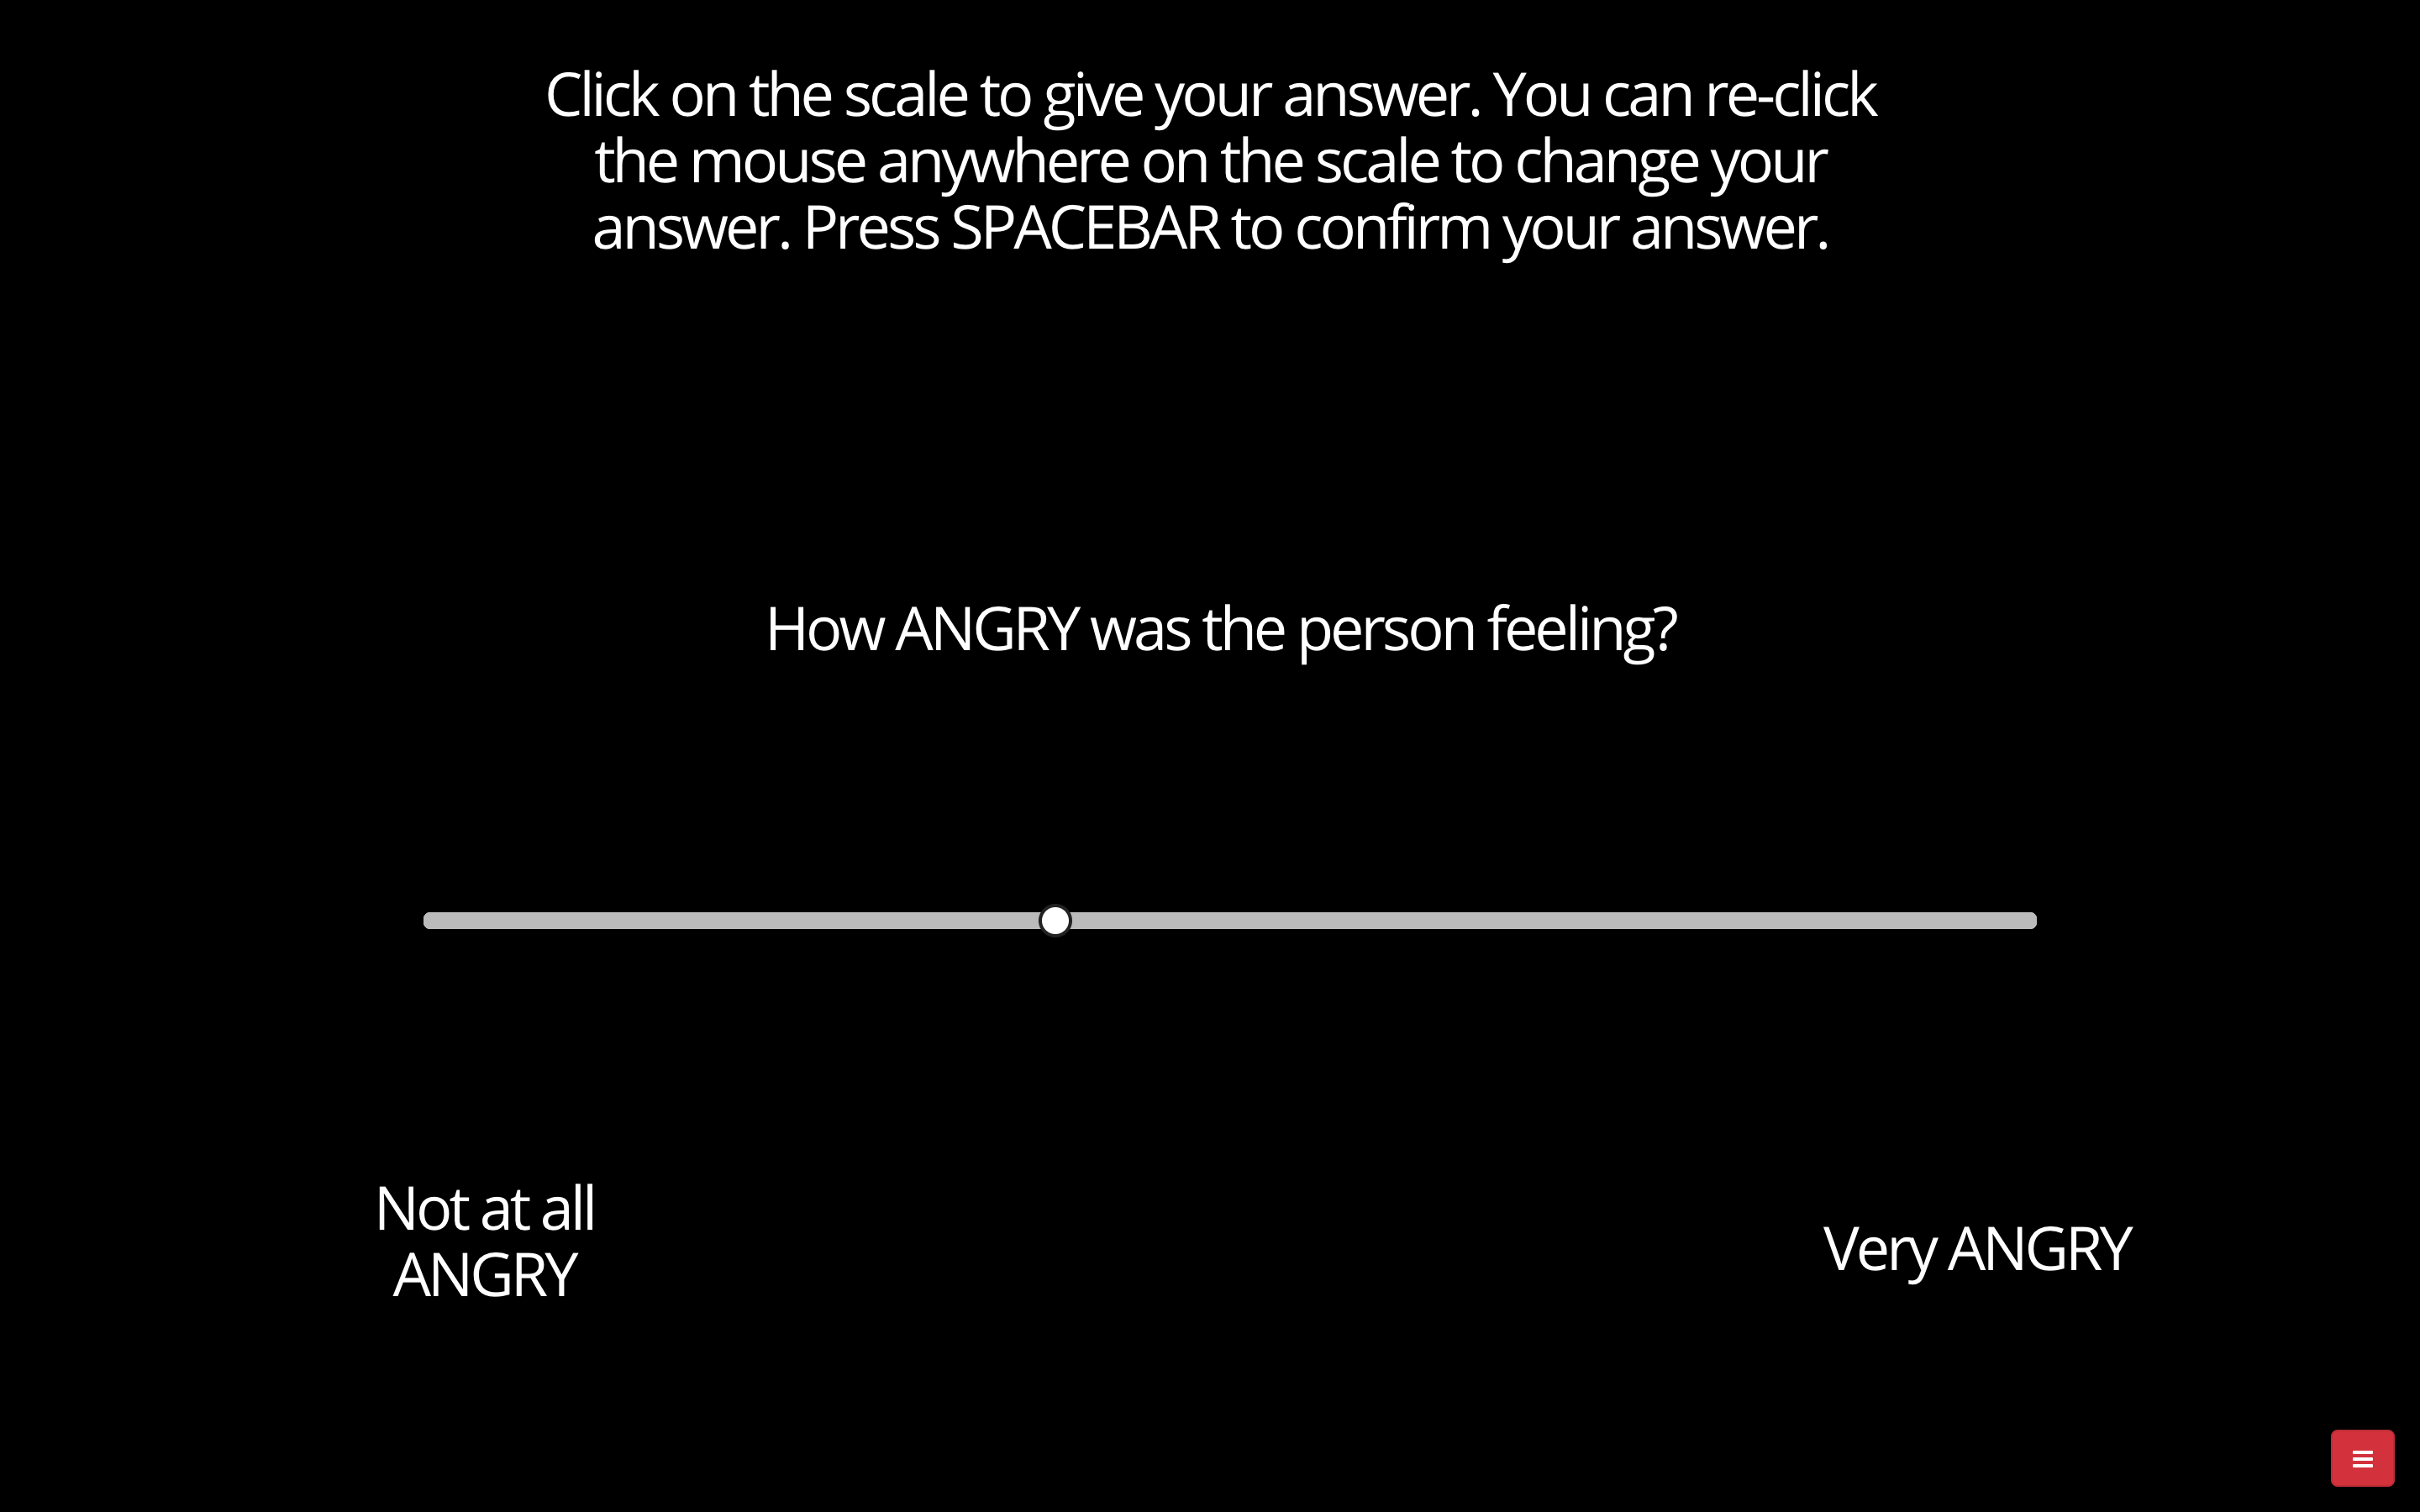
In this task (originally introduced in Sowden et al., 2021), each trial begins with the presentation of a stimulus, which comprises a silent PLF video of an actor expressing one of 3 emotions, whilst saying a sentence, at one of the 3 spatial and 3 kinematic levels. After watching the video, participants are asked to rate how angry, happy and sad the person was feeling. Participants make their ratings on a visual analogue scale, with one end representing ‘Not at all angry/happy/sad’ and the opposite end representing ‘Very angry/happy/sad’. Individuals are asked to make ratings for all three target emotions (angry, happy and sad) on scales, which are presented on screen in a random order, after each PLF video. Each trial takes approximately 25 seconds to complete. Participants complete 3 practice trials (at the 100% spatial and 100% speed level) and then 108 randomly ordered experimental trials (12 per condition) across three blocks. Participants are invited to take a break between blocks.
Score calculation and data-processing
The three emotion rating responses for each trial are transformed into magnitude scores from 0 to 10 (with 0 representing a response of ‘Not at all’ and 10 representing ‘Very’) to 3 decimal places. Emotion recognition accuracy scores are calculated as the correct emotion rating minus the mean of the two incorrect emotion ratings. For instance, for a trial in which an angry PLF was presented, the mean rating of the two incorrect emotions (happy and sad) is subtracted from the rating for the correct emotion (angry).
See https://osf.io/rq8ms for data-processing script
Creative Commons Attribution-NonCommercial (CC BY-NC)
Sowden, S., Schuster, B. A., Keating, C. T., Fraser, D. S., & Cook, J. L. (2021). The role of movement kinematics in facial emotion expression production and recognition.Emotion, 21(5), 1041–1061.
https://doi.org/10.1037/emo0000835
Keating, C.T., Fraser, D.S., Sowden, S., & Cook, J. L. Differences Between Autistic and Non-Autistic Adults in the Recognition of Anger from Facial Motion Remain after Controlling for Alexithymia. Journal of Autism and Developmental Disorders. 52, 1855–1871 (2022).
https://doi.org/10.1007/s10803-021-05083-9
Fully open! Access by URL and searchable from the Open Materials search page